

The “State of the Global Climate 2024” report, released on 19 March 2025, highlights a rapidly warming world.
The report indicates that 2024 was the hottest year in the 175-year observational record, with the global average temperature 1.55°C above the 1850–1900 baseline, establishing a new heat record.
Climate change-driven heat is changing the way we live and work. Extreme heat poses the highest risk in urban centres, particularly in poorer and developing countries. According to C40 Cities, 200 million city residents in 350 cities today live with summer temperatures reaching over 35 °C (95°F). By 2050, around 970 cities will be at least this hot, with much higher exposure in Asia, Africa, and North America. An average high temperature of 35°C (95°F) will mean that heat waves will become far more intense.
As global temperatures rise, cities and communities must prepare for more frequent heat waves and hotter days while mitigating their impacts on health, infrastructure, agriculture, and water resources. The widespread paved surfaces and lack of green space in cities can further exacerbate warming, affecting billions of people in urban areas today.
Heat impacts cities disproportionately. Dense concentrations of buildings and paved surfaces absorb and amplify heat, especially in areas with little tree cover or green space, creating urban heat islands (UHIs). Ironically, cities’ population is set to grow as more and more people move to cities for livelihood and work opportunities.
But as cities heat up, it can adversely impact their economies. A report, Hot Cities, Chilled Economies: Impacts of Extreme Heat on Global Cities, released in 2021, examined 12 cities that are already being impacted by extreme heat – Athens, Bangkok, Buenos Aires, Dhaka, Freetown, London, Los Angeles, Miami, Monterrey, New Delhi, Santiago, and Sydney, shows that they are experiencing substantial work productivity losses that translate to hundreds of millions of dollars.
Work productivity losses impact not only employers but also the workers’ income. Heat-related losses in productivity affect cities in the global south more. Losses from worker productivity as a share of output are highest in low- or middle-income cities in Asian cities like Dhaka at 8.3%, Bangkok at 4.9%, New Delhi at 4.2%, and in Africa, Freetown city at 3.5%. The report’s findings intend to drive climate adaptation and investment in actions and interventions that will cool cities and protect vulnerable people.
Measuring Heat
Measuring heat goes beyond just air temperature. Today, various heat metrics are available for policymakers and planners to meet specific goals and design the interventions they wish to implement.
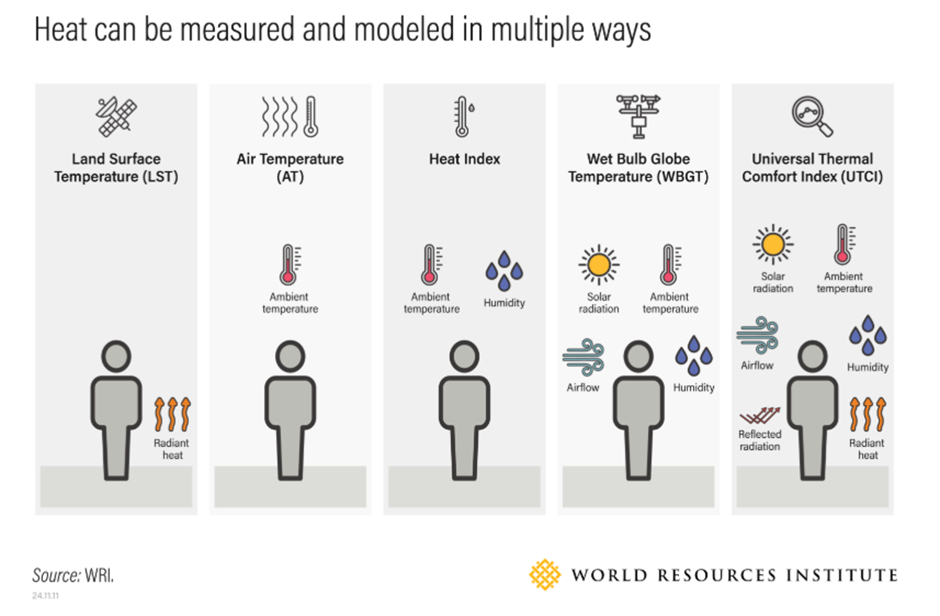
The World Resource Institute article provides information on the many heat measurements available today and how they can inform policymakers on heat mitigation goals. The WRI infographics below show the traditional heat metrics used to measure heat, such as land surface temperature (LST), air temperature, heat index, wet bulb globe temperature (WBGT), and universal thermal comfort, and the tools used to measure them.
Land surface temperature (LST), derived from satellite data, measures the temperature of surfaces like roofs, treetops, and roads. It has long been a key tool for researchers in heat mapping and urban heat analysis.
Air temperature, measured about two meters above the ground, is commonly used in media reports due to its simplicity and ease of modelling. However, it doesn’t account for other factors, such as tree cover or shade, influencing how hot a person feels in a specific area or neighbourhood.
The Heat Index, used by meteorologists, gauges what the temperature “feels like” by factoring in humidity. High humidity makes it harder for the body to cool through sweating, making the temperature feel hotter. In contrast, “dry heat” with low humidity feels cooler because sweat evaporates more quickly, helping the body cool down.
The Wet Bulb Globe Temperature (WBGT) is similar to the Heat Index but also factors in direct sunlight and wind speed, offering a better understanding of how heat feels in different conditions, such as under the sun or with little breeze.
Thermal Comfort Modelling takes it further by calculating the combined effects of various heat sources—sun radiation, reflected radiation, air temperature, wind, and humidity—providing the most comprehensive assessment of human heat exposure.
The article also discusses how policymakers can select metrics to suit their goals, such as planning or formulating policies to make cities more heat resilient and build better infrastructure, and what co-benefits they want to achieve for cooling cities. These goals can include protecting human health during heat wave events, reducing ground-level ozone formation, or lowering energy grid burdens during hot days.
As climate change accelerates the rise of global temperature, densely developed and paved urban areas become increasingly vulnerable to extreme heat due to the urban heat island effect. This phenomenon results in cities being several degrees Celsius warmer than surrounding areas with less development and more greenery. The heat metrics discussed in the article will provide valuable tools for policymakers and urban planners to identify the most effective strategies for safeguarding citizens and infrastructure from the impacts of heat.
Learn more about the various heat metrics: Beyond the Thermometer: 5 Heat Metrics That Drive Better Decision-Making.
Sources:
State of the Global Climate 2024. (2025). World Meteorological Organization. Retrieved from https://wmo.int/sites/default/files/2025-03/WMO-1368-2024_en.pdf?apcid=0065832ea341868dfb335e00
Hot Cities, Chilled Economies. Impacts of extreme heat on global cities. (2021). One Billion People More Resilient. Retrieved from https://onebillionresilient.org/hot-cities-chilled-economies/
Heat Extremes. (2018). C40 Cities. Retrieved from https://www.c40.org/what-we-do/scaling-up-climate-action/water-heat-nature/the-future-we-dont-want/heat-extremes/
Engel, R., Mackres, E., Palmieri, M., & Anzilotti, E. (2025, March 17). Beyond the Thermometer: 5 Heat Metrics That Drive Better Decision-Making. Retrieved from https://www.wri.org/insights/beyond-thermometer-measuring-heat
Leave a Reply