

According to several prominent scientific organisations that track global climate patterns, 2024 is projected to be the hottest year recorded since modern record-keeping began in human history.
This assessment highlights the ongoing warming trend associated with climate change. Key institutions involved in this evaluation include the World Meteorological Organization (WMO), the National Oceanic and Atmospheric Administration (NOAA), the European Space Agency (ESA), the Copernicus Climate Change Service (C3S), and NASA.
While a single year of temperature spikes is insufficient to declare the failure of the Paris Agreement, which aims to limit temperature rise to within 1.5°C this century—a commitment made by approximately 200 countries in 2015—the observation of warming trends averaged over a decade provides compelling evidence that this temperature threshold is likely to be breached in the not-so-distant future.
Below are the assessments of these bodies regarding the 2024 air and sea surface temperatures.
The World Meteorological Organization
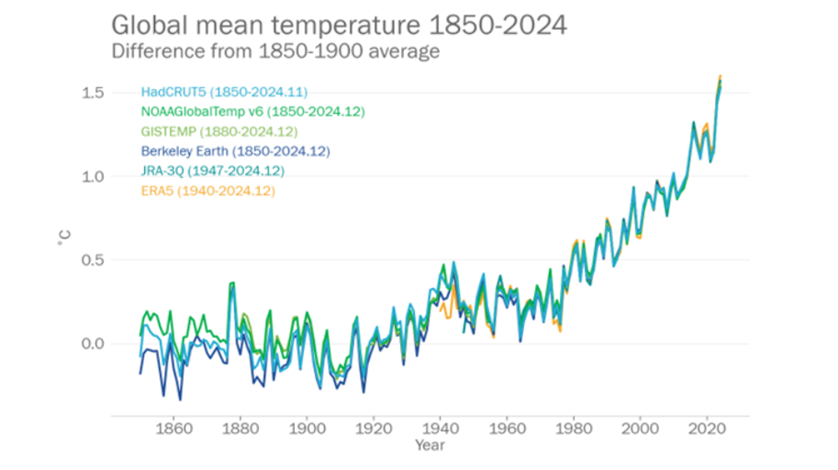
The World Meteorological Organization (WMO) announced on January 10, 2025, that 2024 has been confirmed as the warmest year on record, according to six international datasets. This marks the first time global mean temperatures have exceeded 1.5°C above the average recorded from 1850 to 1900.
The WMO also noted that the past decade, from 2015 to 2024, was one of the ten hottest years documented. In 2024, there were remarkable increases in land and sea surface temperatures and unprecedented ocean heat levels.
The following graph from the World Meteorological Organization (WMO) presents a consolidated analysis of six datasets, illustrating a warming trend in relation to the 1850-1900 average.
The WMO also cited a study published in Advances in Atmospheric Sciences, which found that warming in 2024 played a key role in the record high temperatures.
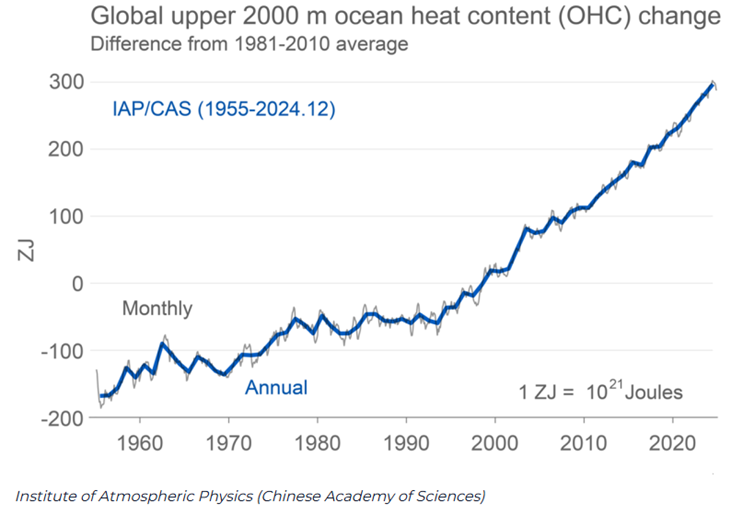
A study by Prof. Lijing Cheng from the Institute of Atmospheric Physics at the Chinese Academy of Sciences, involving a collaborative team of 54 scientists from seven countries and 31 institutes, reveals that the ocean is experiencing unprecedented warmth, as recorded by humans. This temperature increase is evident at the surface and extends to the upper 2000 metres.
A study using data from the Institute of Atmospheric Physics indicates that the ocean absorbs about 90% of the excess heat from global warming, making ocean heat content a crucial climate change indicator. From 2023 to 2024, the global upper 2000 metres of ocean heat content increased by 16 zettajoules (10²¹ Joules), roughly 140 times the world’s total electricity generation in 2023.
Below is the graph from the study that illustrates the warming trend in ocean temperatures:
National Oceanic and Atmospheric Administration (NOAA)
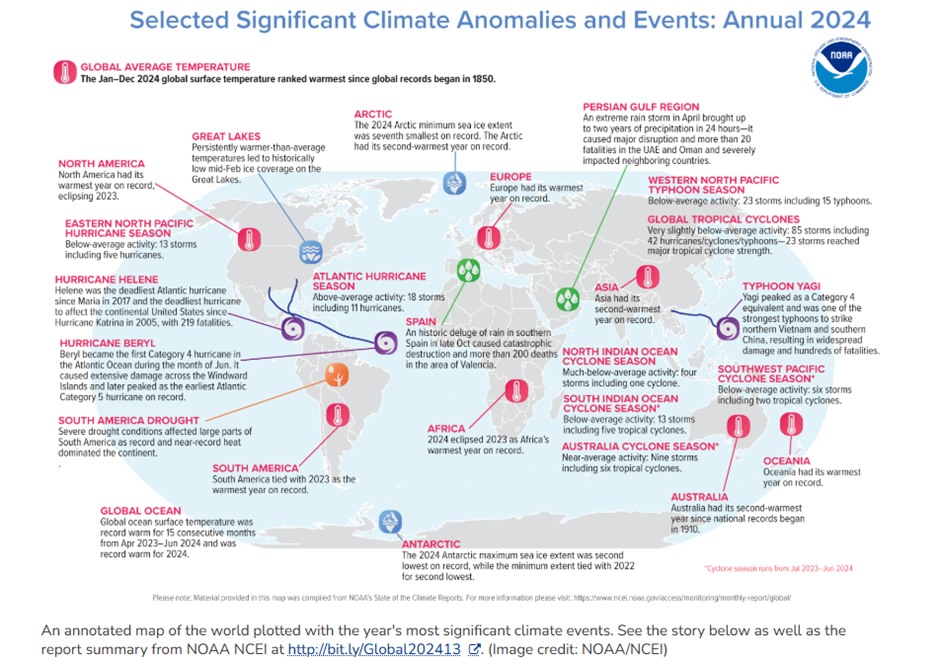
According to NOAA, Earth’s average land and ocean surface temperature in 2024 was 1.29°C above the 20th-century average, the highest global temperature among all years in NOAA’s 1850-2024 climate record. It was 0.10°C warmer than 2023, the warmest year on record. Also, the earth’s 10 warmest years since 1850 have all occurred in the past decade.
Regionally, Africa, Europe, North America, Oceania and South America (tied with 2023) had their warmest year on record. Asia and the Arctic had their second-warmest year on record.
Along with the historical heat, Antarctic Sea ice coverage dropped to its second-lowest extent (coverage) on record. Antarctic sea ice extent averaged 4.00 million square miles in 2024, the second lowest on record.
The 2024 upper ocean heat content, the amount of heat stored in the upper 2,000 metres of the ocean, was the highest on record. NOAA has been tracking the indicator globally since 1958, and the five highest values have all occurred in the last five years.
The infographic from NOAA below shows the weather and temperature anomalies observed in 2024.
Copernicus Climate Change Service (C3S)
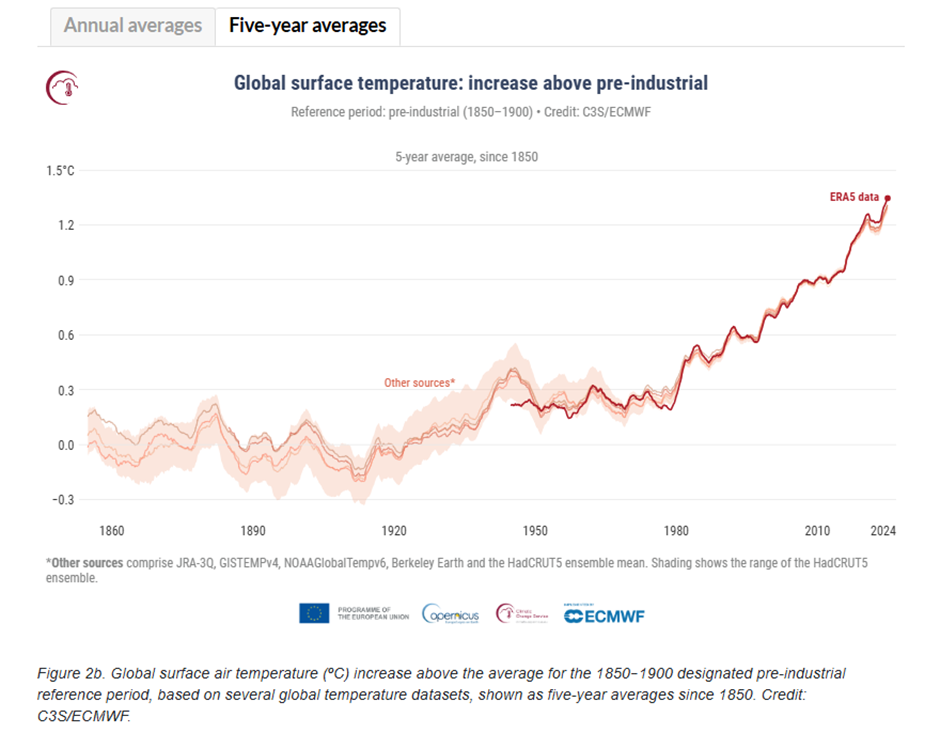
Copernicus concurs with all the climate monitoring bodies that 2024 was the warmest year in a multi-dataset global temperature record from 1850.
It notes:
- The year was also 0.12°C higher than the previous highest annual value in 2023, 0.72°C warmer than the 1991–2020 average, and 1.60°C warmer than the pre-industrial level, making it the first calendar year to exceed 1.5°C above that level.
- The last ten years have been the warmest ten years on record.
- It has more “strong heat stress” days than average. On 10 July, around 44% of the globe was affected by ‘strong’ to ‘extreme heat stress’, a 5% increase from the average annual maximum.
The Copernicus graph below shows the global five-year average temperatures since 1850.
Sea Surface Temperature (SST)
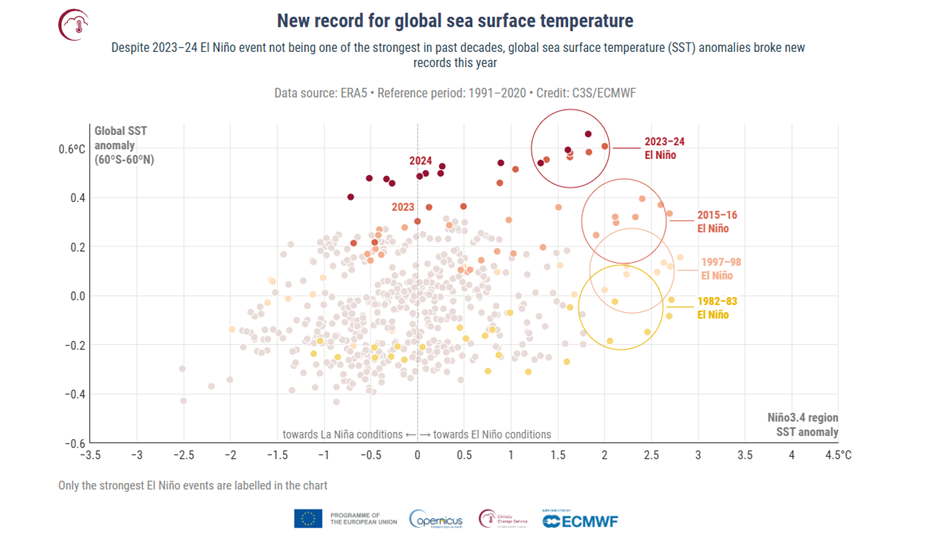
The average sea surface temperature (SST) for the extra-polar oceans—those regions outside the polar areas in both the Northern and Southern Hemispheres—reached an unprecedented high of 20.87°C in 2024. From January to June of that year, SSTs in these areas consistently hit record levels, continuing a trend of monthly highs that began in May 2023. This rise has been notably affected by the peak and subsequent decline of the El Niño phenomenon in the equatorial Pacific, which persisted from mid-2023 to mid-2024.
Remarkably, SSTs have reached record levels for 15 consecutive months. Although the impact of this El Niño event is not as intense as those experienced in previous years, such as 1982-1983, 1997-1998, and 2015-2016, the monthly SSTs observed in 2023 and 2024 remain significantly higher than in earlier years.
Below is the Copernicus graph comparing the monthly Sea Surface Temperature anomalies for the extra-polar ocean (60°S–60°N vertical axis). The x-axis represents the temperature deviation in a specific area of the tropical Pacific from normal levels, which is used to identify El Niño events. The y-axis indicates the global average sea-surface temperature.
As the atmosphere warms, it can hold approximately 7% more water vapour for each additional degree Celsius. This increased water vapour content further enhances warming, a phenomenon known as “temperature-water vapour feedback.” The rise in atmospheric moisture also increases the likelihood of extreme rainfall events and contributes energy to more intense tropical storms.
National Aeronautics and Space Administration (NASA)
Global temperatures in 2024 were 1.28°C above the agency’s 20th-century baseline 1951-1980, which tops the record set in 2023. The new record comes after 15 months (June 2023 through August 2024) of monthly temperature records — an unprecedented heat streak.
“Once again, the temperature record has been shattered — 2024 was the hottest year since record-keeping began in 1880,” said NASA Administrator Bill Nelson. “Between record-breaking temperatures and wildfires currently threatening our centres and workforce in California, it has never been more important to understand our changing planet.”
Source:
WMO confirms 2024 as warmest year on record at about 1.55°C above pre-industrial level. (2025, January 10). World Meteorological Organization. Retrieved from https://wmo.int/news/media-centre/wmo-confirms-2024-warmest-year-record-about-155degc-above-pre-industrial-level
2024 was the world’s warmest year on record. (2025, January 10). National Oceanic and Atmospheric Administration. Retrieved from https://www.noaa.gov/news/2024-was-worlds-warmest-year-on-record#:
2024 Was the Warmest Year on Record. (2024). NASA. Retrieved from https://earthobservatory.nasa.gov/images/153806/2024-was-the-warmest-year-on-record
The 2024 Annual Climate Summary Global Climate Highlights 2024. (2025, January 10). Copernicus. Retrieved from https://climate.copernicus.eu/global-climate-highlights-2024
How to make sense of 2024’s wild temperatures. (2025, January 10). The Economist. Retrieved from https://www.economist.com/graphic-detail/2025/01/10/how-to-make-sense-of-2024s-wild-temperatures?
Leave a Reply